Output
Defines what output is provided from Kiva.
Example:
Output:
  Output Report:
    Minimum Reporting Frequency: 60 # [min]
    Reports:
      - 0 # Slab Core Average Heat Flux [W/m2]
      - 1 # Slab Core Average Temperature [K]
      - 2 # Slab Core Average Effective Temperature [C]
      - 3 # Slab Core Total Heat Transfer Rate [W]
      - 4 # Slab Perimeter Average Heat Flux [W/m2]
      - 5 # Slab Perimeter Average Temperature [K]
      - 6 # Slab Perimeter Average Effective Temperature [C]
      - 7 # Slab Perimeter Total Heat Transfer Rate [W]
      - 8 # Slab Average Heat Flux [W/m2]
      - 9 # Slab Average Temperature [K]
      - 10 # Slab Total Heat Transfer Rate [W]
      - 11 # Wall Average Heat Flux [W/m2]
      - 12 # Wall Average Temperature [K]
      - 13 # Wall Average Effective Temperature [C]
      - 14 # Wall Total Heat Transfer Rate [W]
      - 15 # Foundation Average Heat Flux [W/m2]
      - 16 # Foundation Average Temperature [K]
      - 17 # Foundation Total Heat Transfer Rate [W]
  Output Snapshots:
    -
     Directory: Output/Profile
     Size: 800
     Frequency: 1
     Start Date: 2015-Dec-21
     End Date: 2015-Dec-21
     X Range: [0, 30]
     Z Range: [-30, 0.3048]
Output Report
The output report defines what variables are written to the CSV output file and how often they are written.
Example:
Output Report:
  Minimum Reporting Frequency: 60 # [min]
  Reports:
    - 0 # Slab Core Average Heat Flux [W/m2]
    - 1 # Slab Core Average Temperature [K]
    - 2 # Slab Core Average Effective Temperature [C]
    - 3 # Slab Core Total Heat Transfer Rate [W]
    - 4 # Slab Perimeter Average Heat Flux [W/m2]
    - 5 # Slab Perimeter Average Temperature [K]
    - 6 # Slab Perimeter Average Effective Temperature [C]
    - 7 # Slab Perimeter Total Heat Transfer Rate [W]
    - 8 # Slab Average Heat Flux [W/m2]
    - 9 # Slab Average Temperature [K]
    - 10 # Slab Total Heat Transfer Rate [W]
    - 11 # Wall Average Heat Flux [W/m2]
    - 12 # Wall Average Temperature [K]
    - 13 # Wall Average Effective Temperature [C]
    - 14 # Wall Total Heat Transfer Rate [W]
    - 15 # Foundation Average Heat Flux [W/m2]
    - 16 # Foundation Average Temperature [K]
    - 17 # Foundation Total Heat Transfer Rate [W]
| Required: | No |
| Type: | Compound object |
Minimum Reporting Frequency
Kiva can provide timeseries output at the same interval as the timestep. This input will override to delay output and write it a a lower frequency. This helps to reduce the output size when running at very small timesteps.
| Required: | No |
| Type: | Integer |
| Units: | min |
| Default: | 60 |
Reports
This is a list of report ID numbers that Kiva will write to the CSV output file. The IDs and there corresponding output are listed in the table below:
When `Perimeter Surface Width`_ is not specified, the entire slab is considered to be “Core”.
“Effective Temperature” is used for preprocessed ground temperatures in whole-building simulation engines. These values represent the effective temperature on the ground’s side of the slab core, slab perimeter, or wall layers. When used in a whole-building simulation, the construction in the whole-building model should be the same as the layers defined for the respective surface in Kiva (ignoring any insulation objects).
| Required: | No |
| Type: | List [N] of integers |
| Default: | No reports |
Output Snapshots
Output snapshots are used to graphically visualize domain temperatures and/or heat fluxes. Each series of snapshots is part of a list within the Output Snapshots object. A series consists of potentially many snapshots taken of a slice of the domain at a user-specified frequency between a start and end date.
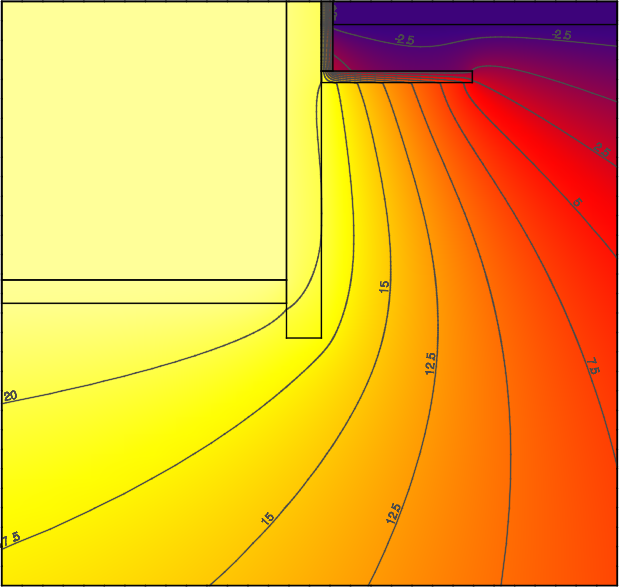
Example profile snapshot
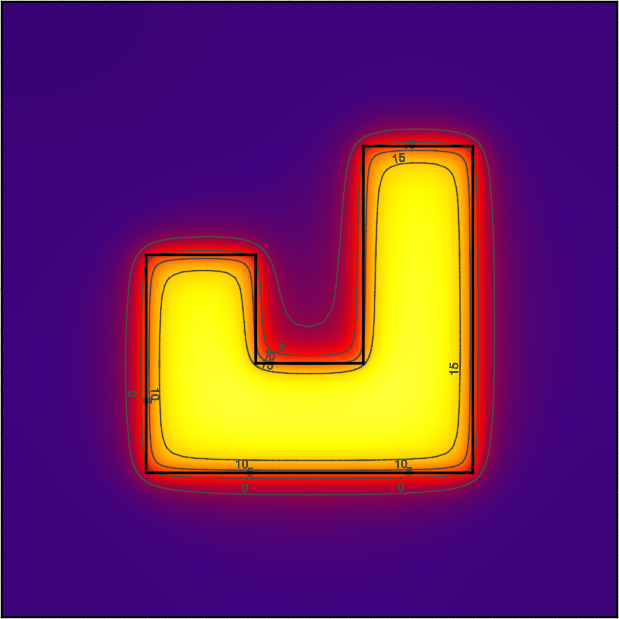
Example plan snapshot
Example:
Output Snapshots:
  -
   Directory: Output/Profile
   Size: 800
   Frequency: 1
   Start Date: 2015-Dec-21
   End Date: 2015-Dec-21
   X Range: [0, 30]
   Z Range: [-30, 0.3048]
| Required: | No |
| Type: | List [N] of compound objects |
Directory
Directory where snapshots are created (in same directory as the output CSV file). An ordered file name, XXXX.png, identifies each snapshot within a series. For example, the 134th snapshot in a series with a directory name of Profile will be created as Profile/0134.png.
| Required: | Yes |
| Type: | Directory Path |
Size
The size in pixels of each snapshot file. Outputs are all generated as square images.
| Required: | No |
| Type: | Integer |
| Units: | pixels |
| Default: | 800 |
Frequency
The frequency, in hours, at which new snapshots are taken. The default is 36 hours so that the snapshots capture both nighttime and daytime output.
| Required: | No |
| Type: | Integer |
| Units: | hours |
| Default: | 36 |
Start Date
Specifies the start date of the snapshots. Snapshots begin at 12:00am of this day. This is specified as a date string (e.g., YYYY-Mon-DD, YYYY/MM/DD).
| Required: | No |
| Type: | Date string |
| Default: | Simulation start date |
End Date
Specifies the end date of the snapshots. Snapshots end before 12:00am of the following day. This is specified as a date string (e.g., YYYY-Mon-DD, YYYY/MM/DD).
| Required: | No |
| Type: | Date string |
| Default: | Simulation end date |
X Range
Defines the range the domain captured in the snapshot in the “X”-direction ([Xmin, Xmax]). By default the X Range will show the entire extents of the “X” direction, and may not show the detail where heat is flowing near the foundaiton. For three-dimensional solutions, a slice along a plane in the “X”-direction can be specified by giving both Xmin and Xmax the same value.
The snapshot will round the range to the next cell division.
| Required: | No |
| Type: | List [2] of numerics |
| Units: | m |
| Default: | “X” extents of the domain |
Y Range
Defines the range the domain captured in the snapshot in the “Y”-direction ([Ymin, Ymax]). By default the Y Range will show the entire extents of the “Y” direction, and may not show the detail where heat is flowing near the foundaiton. For three-dimensional solutions, a slice along a plane in the “Y”-direction can be specified by giving both Ymin and Ymax the same value. For two-dimensional simulations this should not be included.
The snapshot will round the range to the next cell division.
| Required: | No |
| Type: | List [2] of numerics |
| Units: | m |
| Default: | “Y” extents of the domain |
Z Range
Defines the range the domain captured in the snapshot in the “Z”-direction ([Zmin, Zmax]). By default the Z Range will show the entire extents of the “Z” direction, and may not show the detail where heat is flowing near the foundaiton. For three-dimensional solutions, a slice along a plane in the “Z”-direction can be specified by giving both Zmin and Zmax the same value.
The snapshot will round the range to the next cell division.
| Required: | No |
| Type: | List [2] of numerics |
| Units: | m |
| Default: | “Z” extents of the domain |
Plot Type
Defines the type of output plotted. Options are TEMPERATURE and HEAT-FLUX. For HEAT-FLUX, the user may also specify a Flux Direction for output.
| Required: | No |
| Type: | Enumeration |
| Values: | TEMPERATURE or HEAT-FLUX |
| Default: | TEMPERATURE |
Flux Direction
When Plot Type is HEAT-FLUX, the snapshots show the magnitude of heat flux throughout the domain. This input allows the user to specify whether they want to display the overall magnitude, MAG, or the magnitude in a given direciton, X, Y, or Z.
| Required: | No |
| Type: | Enumeration |
| Values: | MAG, X, Y, or Z |
| Default: | MAG |
Unit System
Defines the units used in the output snapshots. Options are IP (Inch-Pound), and SI (International System). Keep in mind that regardless of this value, all other inputs are still defined in the SI unit system.
| Required: | No |
| Type: | Enumeration |
| Values: | IP or SI |
| Default: | SI |
Output Range
Specifies the range of output shown in the snapshots. The units of the range depend on the value of Plot Type and Unit System.
| Required: | No |
| Type: | List [2] of numerics |
| Units: | Depends |
| Default: | [-20, 40] |
Color Scheme
Specifies the color scheme used within the Output Range. Options are:
CMR, best color scheme where colors progress in brightness with magnitude (prints in black-and-white),JET, like a rainbow(!), but doesn’t print well,NONE, do not show any output. This can be used to illustrate meshing independent of results.
| Required: | No |
| Type: | Enumeration |
| Values: | CMR, JET, or NONE |
| Default: | CMR |
Mesh
Enables the display of the mesh (discretized cells).
| Required: | No |
| Type: | Boolean |
| Default: | False |
Axes
Enables the display of the spatial axes, and the colorbar.
| Required: | No |
| Type: | Boolean |
| Default: | True |
Number of Contours
Specifies the number of countours to generate between the values specified in Output Range.
| Required: | No |
| Type: | Integer |
| Default: | 13 |